SpaceX's $28,500,000,000,000 TAM
What the aspiration alone implies about the capital required to attempt material participation in the claimed market.

SpaceX’s S-1, filed with the Securities and Exchange Commission on May 20, 2026, estimates the company’s quantifiable total addressable market at $28.5 trillion, which it describes as “the largest actionable TAM in human history.” The figure is approximately fifteen hundred times the company's current annual revenue. The construction, worked component by component against the cited sources and applied to operationally defensible share targets at industry-standard capital intensity, implies a capital base several multiples larger than the IPO raise and the disclosed commitments combined — before any meaningful participation in the claimed market is achieved. The aspiration alone, before any execution, is the issue.
Summary
SpaceX’s S-1 estimates the company’s quantifiable total addressable market at $28.5 trillion. The aspiration — described in the prospectus as “the largest actionable TAM in human history” — gets translated into a specific methodology that comprises seven components across three operating segments: $370 billion in Space, $1.6 trillion in Connectivity ($870 billion Broadband and $740 billion Mobile, plus enterprise and government), and $26.5 trillion in AI ($2.4 trillion infrastructure, $760 billion consumer subscriptions, $600 billion digital advertising, and $22.7 trillion enterprise applications). The aspiration and the disclosure are not the same thing.
The disclosure raises cash implications and addresses them qualitatively. The S-1’s Risk Factors acknowledge that TAM estimates “may prove to be inaccurate” and that the growth strategy “will require significant capital expenditures.” The disclosure architecture permits the issue to be named in risk-factor prose without being quantified. The framework’s analytical work supplies the quantification: at industry-standard capital intensity applied to operationally defensible share targets for the six methodology-bearing components, the implied capital base through 2030 is approximately $850–900 billion. Against disclosed funding sources of approximately $200–275 billion, the funding gap is approximately $575–700 billion.
The aspiration requires capital at scale. The disclosed funding architecture, dominated by Class A share issuance for major strategic commitments plus the IPO cash event, is structured for acquisitions and partnerships rather than for the physical infrastructure that the TAM construction implies. Stock-denominated consideration funds acquisitions where the seller accepts stock and partnerships where the counterparty accepts stock-denominated obligations. The physical infrastructure that the TAM construction implies is paid for in cash, ultimately sourced from operating cash flow, debt issuance, or equity issuance converted to cash in the capital markets. At the implied scale, the equity-issuance-to-cash channel would require capital markets to absorb dilution at a magnitude that itself becomes a constraint.
The disclosed governance and control structure provides controller discretion on the timing and cost of investments, separate from their executional risk. Mr. Musk holds approximately 85% of voting power through the dual-class share structure. The company operates under the controlled-company exemption. The controller decides when and on what terms capital gets deployed against the implied requirements. The executional risk — whether Starship works, whether orbital AI compute is feasible, whether Terafab succeeds, whether Starlink Mobile reaches the addressable device base — is separate from the discretionary control over the deployment.
Methodology and Anchoring
The headline TAM disclosure appears in the Business section under “Our Market Opportunity,” and reads in full:
“We believe we have identified the largest actionable total addressable market (’TAM’) in human history. We estimate that our quantifiable TAM is $28.5 trillion, consisting of $370 billion in Space from space-enabled solutions; $1.6 trillion in Connectivity across $870 billion in Starlink Broadband and $740 billion in Starlink Mobile as well as additional opportunities in enterprise and government; $26.5 trillion in AI across $2.4 trillion in AI infrastructure, $760 billion in consumer subscriptions, $600 billion in digital advertising, and $22.7 trillion in enterprise applications. For illustrative purposes of sizing our addressable market opportunity, we exclude China and Russia from our global estimates.” [S-1, Prospectus Summary, p. 8]
The Risk Factors section addresses the methodology in compact form:
“With respect to our Space segment, these estimates rely in part on estimates published by Novaspace regarding the size of the global market for space-enabled solutions, including spacecraft manufacturing, launch services and related activities. Our connectivity market estimates are based in part on estimates of the number of households, businesses, aircraft and maritime vessels globally derived from third-party sources, together with assumptions regarding ARPU and monthly service revenue derived from third-party industry data and our internal expectations regarding pricing, adoption rates and service penetration across different geographic regions and economic environments. Our AI market estimates are based in part on projections of global data center compute demand from third-party sources, including estimates published by RAND Corporation, together with internal assumptions regarding the portion of global compute capacity that may be utilized for AI workloads and other operational assumptions such as power usage, utilization rates and pricing.” [S-1, Risk Factors, p. 50]
The Industry and Market Data section lists 41 numbered citations from sources including Novaspace, RAND Corporation, Silicon Data, Omdia, Ericsson, Euromonitor International, the Digital Cooperation Organization, McKinsey & Company, Boston Consulting Group, JLL, the International Energy Agency, the World Bank, and others [S-1, pp. iii–iv]. The S-1 notes:
“Some market data and statistical information contained in this prospectus are also based on management’s estimates and calculations, which are derived from our review and interpretation of publicly available industry publications, our internal research and our knowledge of the markets in which we currently, and will in the future, operate, as well as the sources referred to above. This information involves a number of assumptions and limitations, and you are cautioned not to give undue weight to such information.” [S-1, General Information, p. iv]
The Risk Factors include the company’s own acknowledgment that the TAM estimates may be inaccurate: “The estimates of future market opportunity and forecasts of market growth, and our ability to capture such markets, included in this prospectus may prove to be inaccurate.” [S-1, Risk Factors summary, p. 21]
On the anchor year. The TAM disclosure does not specify a year. Industry analytical convention requires market-size forecasts to anchor to a specified horizon — McKinsey publishes “AI Market 2030”; Gartner publishes annual forecasts with explicit projection years; Bain anchors strategic studies to specified horizons. The S-1’s TAM is presented in present tense, “our quantifiable TAM is $28.5 trillion,” without a year. This is a methodological gap. The construction itself synthesizes inputs of different vintages — present-year measurements (the DCO digital economy 2026; the World Bank GDP 2026), forward-projected demand (RAND power demand to 2030), forward-projected pricing held from 2025 (the Silicon Data H100 rental rate), and population counts that change slowly. The aggregation does not correspond to any specific year.
For analytical purposes this analysis anchors to 2030. This is the conventional analytical horizon, the period to which most cited sources project, and a conservative choice — 2030 is approximately the nearest defensible horizon for a forward-looking TAM, and most projection sources extend through 2030 with declining confidence past that point. The S-1 does not anchor; the framework imposes the anchor for analytical purposes and notes the gap.
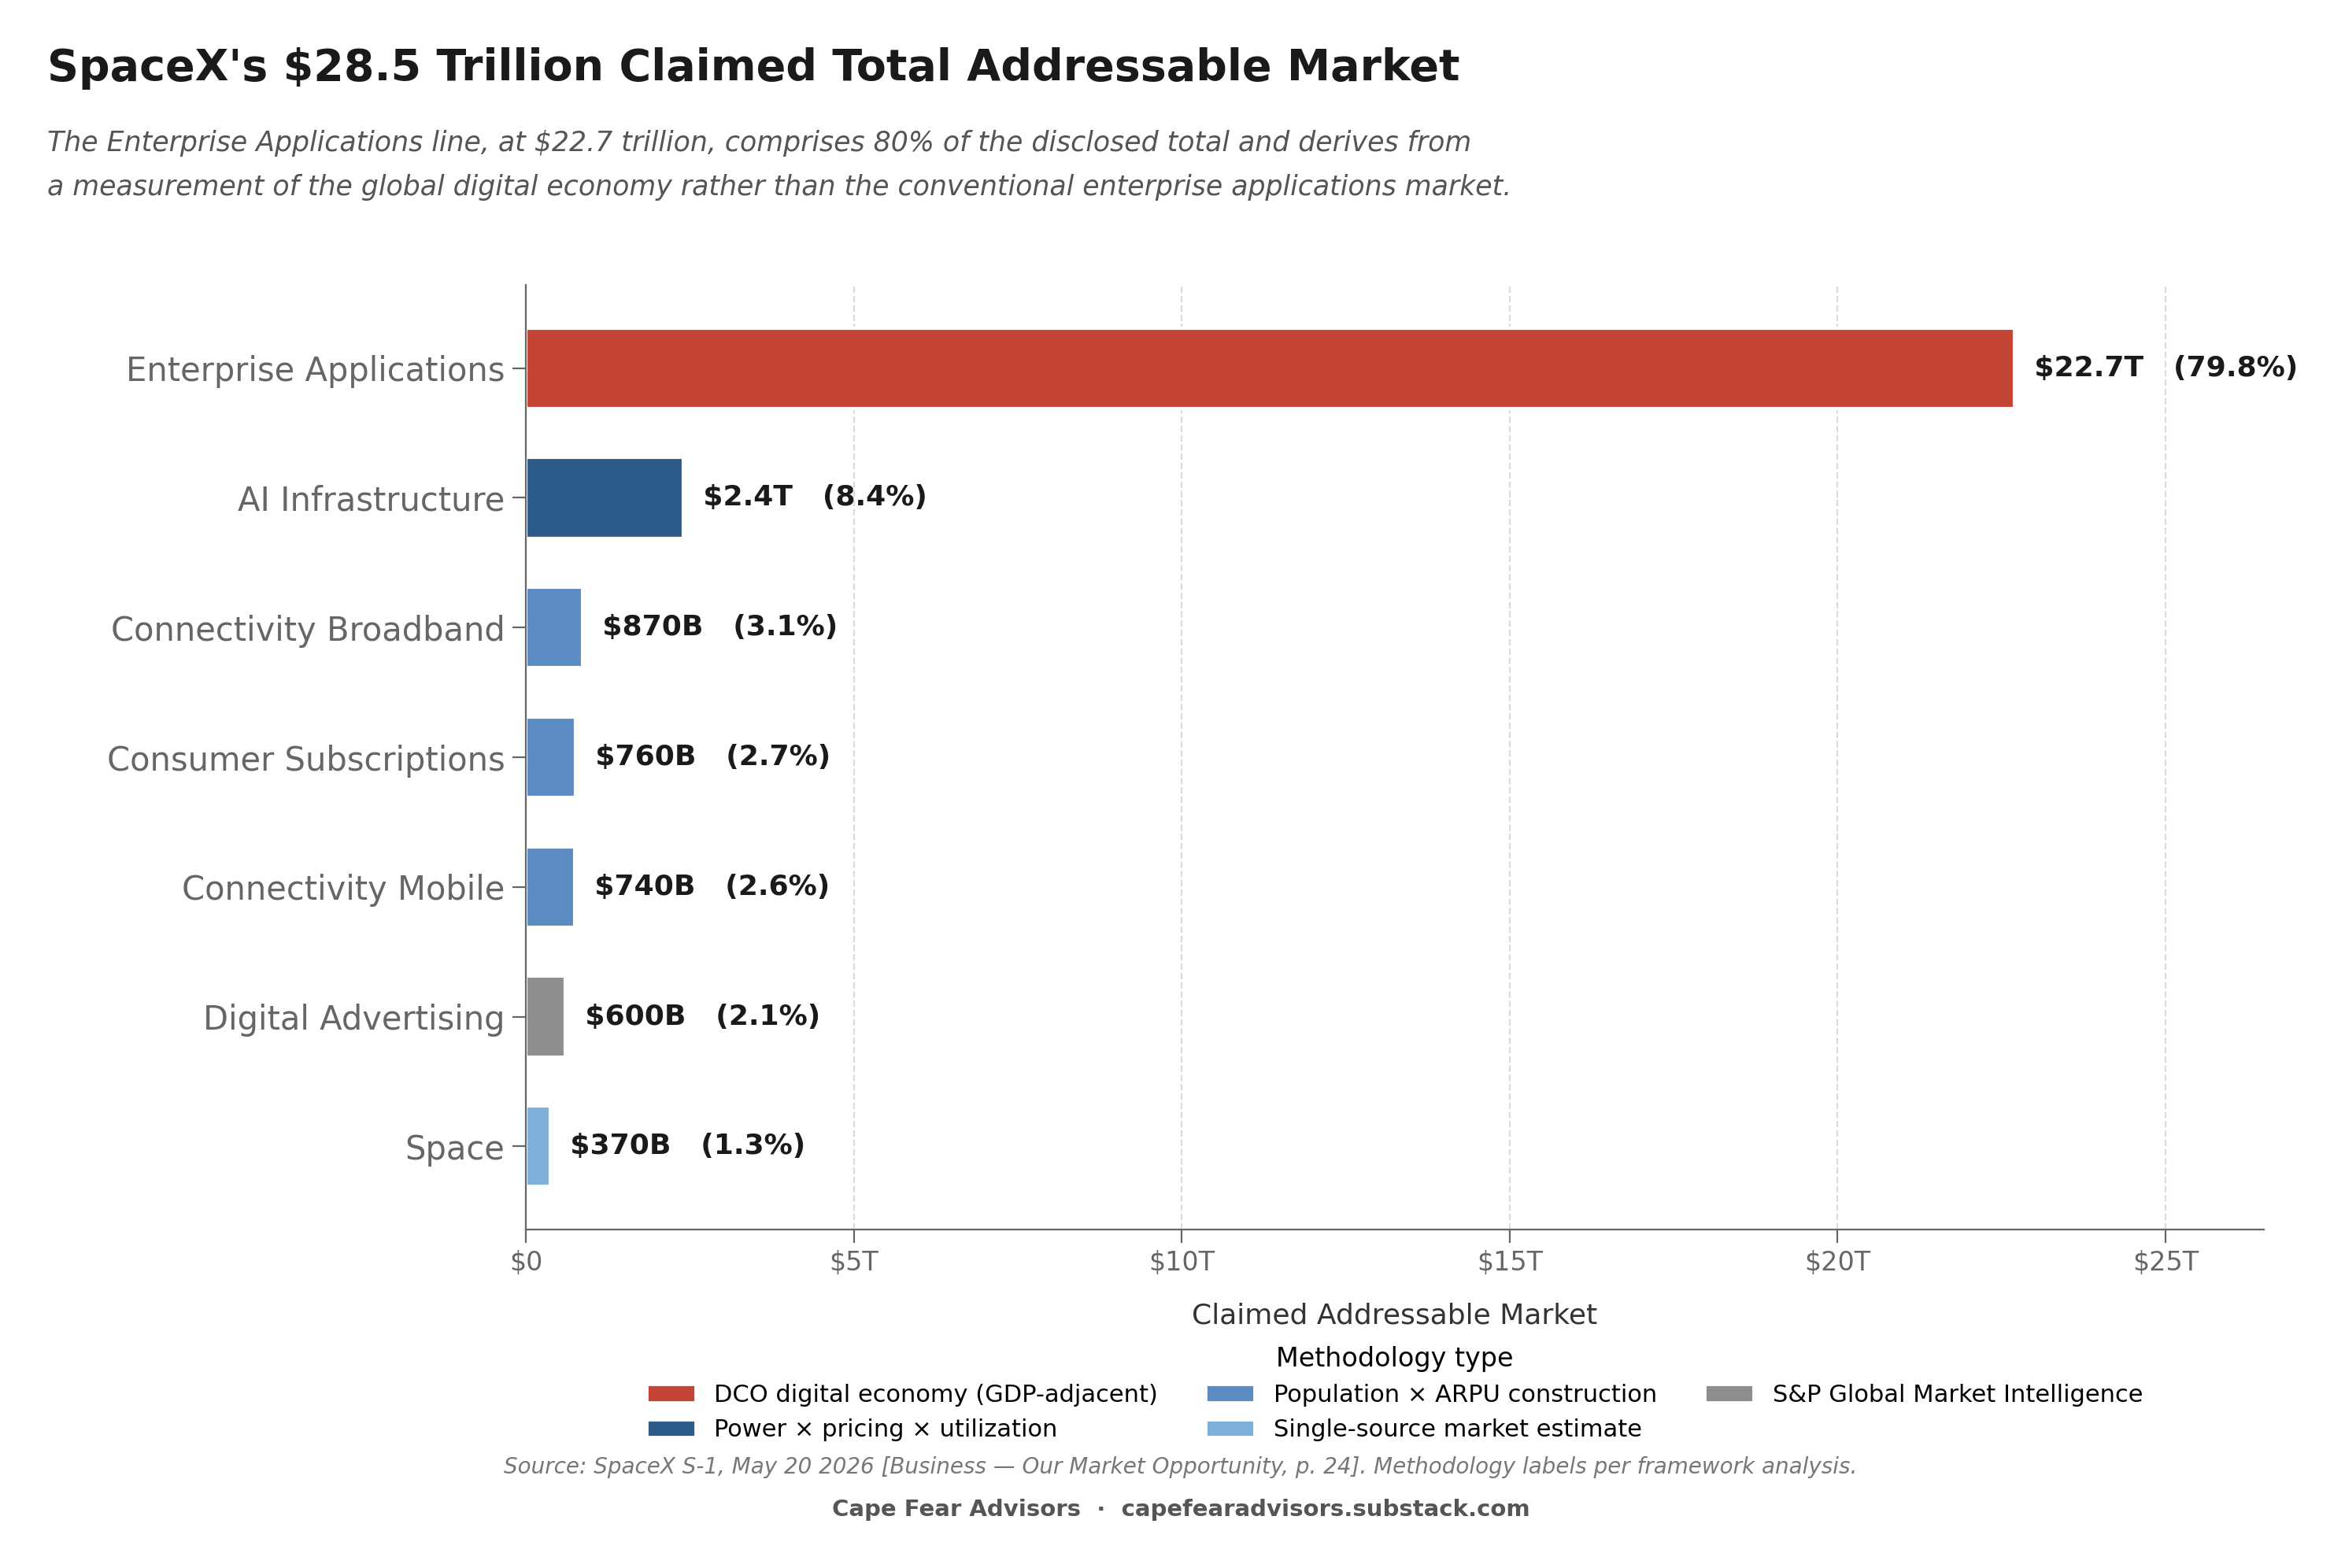
Caption: The disclosed TAM construction is dominated by a single line — Enterprise Applications at $22.7 trillion — that derives from a measurement of the global digital economy rather than the conventional enterprise applications market. The remaining six components, taken together, account for $5.7 trillion (20% of the total) and bear methodologies that triangulate against named industry sources.
Space — $370 Billion
The Space TAM is constructed from a single source: Novaspace’s 12th Edition Space Economy Report, January 29, 2026 [S-1 citation xxi]. The Risk Factors paragraph names the construction directly: estimates from Novaspace covering “spacecraft manufacturing, launch services and related activities.”
Novaspace, formed in 2024 from the merger of Euroconsult and SpaceTec Partners, is among the most cited specialist research firms for the space industry. Their published 2024 global space economy estimate is approximately $596 billion. Their medium scenario projects the commercial space economy reaching approximately $700–800 billion by 2030 and $944 billion by 2033, with a long-range scenario extending to $1.8 trillion by 2035.
The Space Foundation’s “The Space Report 2025 Q2” [S-1 citation xxxii] places the 2024 global space economy at $613 billion, split approximately $293 billion commercial and $320 billion government. The $370 billion SpaceX-addressable figure sits between Novaspace’s current commercial figure and the Space Foundation’s combined total — consistent with a 2030 horizon for the commercial space economy at approximately 45–50% addressable share for SpaceX.
The operational reality: SpaceX’s Space segment generated $4,086 million in 2025 revenue and $619 million in Q1 2026 (approximately $2.5 billion annualized), with a Q1 2026 operating loss of $662 million [S-1, Segment Operating and Financial Data, p. 23]. Mass to orbit reached 7,400 metric tons cumulatively, with 99% mission success across the Falcon family [S-1, Business — Our Unparalleled Launch Capabilities, p. 14]. Federal customers represent the majority of Space segment revenue: “In 2025, we launched 11 of 12 National Security Space Launch (NSSL) medium and heavy lift missions and all five U.S. crew and cargo missions to the International Space Station for NASA” [S-1, Business — Our Leading Capabilities Across Space, Connectivity, and AI, p. 16].
The Space line is the most defensible component of the TAM disclosure. The methodology cites a credible specialist source; the source’s own projections support a figure in this range for 2030 commercial space economy; SpaceX is operationally positioned through launch dominance and vertical integration to address a meaningful share. The Space line is also the regulatory-compliant articulation of the company’s broader positioning across multiple disclosure registers — what the company has expressed less formally elsewhere as the intent to define the commercial space economy.
The capital implication. Space is the most capital-intensive segment per the S-1’s own disclosure. 2025 Space capex was $3,832 million against $4,086 million of segment revenue — 94% capex-to-revenue, with Q1 2026 at 170% [S-1, Capital Expenditures, p. 23]. Of 2025 capex, $3,004 million funded Starship development alone, approximately 75% of total Space capex [S-1, Prospectus Summary, p. 5]. The Space segment is fundamentally a development-stage business; the existing capital deployment is the down payment on Starship reaching commercial viability at scale.
Industry-standard capital intensity for vertically integrated space companies addressing multiple market segments is approximately 3.0–4.0x PP&E-to-revenue at maturity, based on benchmarks from aerospace prime contractors and satellite operators. Applied to $370 billion in addressable Space revenue, the implied PP&E base at full addressable scale is approximately $1.1–1.5 trillion. The operationally relevant question is what capital is required through 2030 to position the company for that scale: cumulative Starship development through commercial readiness (estimated $50–75 billion by industry analysts), satellite manufacturing infrastructure expansion ($20–30 billion), launch infrastructure across multiple sites ($15–25 billion), and supporting infrastructure including propellant production and ground systems ($10–20 billion). Cumulative incremental Space capital required through 2030 to operate at the scale implied by the TAM positioning: approximately $110–165 billion beyond current PP&E.
The Space segment is loss-making at current scale. Operating cash flow from Space is negative; capital must come from sources outside the segment. The S-1 confirms approximately one-fifth of total company revenue is federal [S-1, Risk Factors, p. 57]; the Space segment skew is much higher, with federal customers representing the majority of segment revenue. The capital required to position SpaceX to address the $370 billion claimed Space market through 2030 is financeable only with federal procurement that expands at scale, with continued cross-segment subsidization from the Connectivity segment’s profitability, with external financing — or with all three.
Connectivity Broadband — $870 Billion
The Connectivity Broadband construction follows the methodology described in the TAM Risk Factor paragraph: estimates of household counts from third-party sources, multiplied by ARPU and monthly service revenue assumptions. The named third-party sources include Omdia’s “Broadband Op Subs by Technology” [S-1 citation xxiii], Ericsson’s “Global Fixed Broadband Market Outlook” [S-1 citation v], Grand View Research’s broadband services market analysis [S-1 citation viii], Euromonitor International’s households-by-country data [S-1 citation vi], and IDC’s “Consumer Market Model H2 2025” [S-1 citation ix].
The reproducible math: approximately 2.3 billion households globally per Euromonitor’s 2026 edition; excluding China (approximately 480 million households) and Russia (approximately 55 million households) leaves approximately 1.75 billion addressable households. At a weighted-average ARPU of approximately $42 per month, 1.75 billion households × $42 × 12 months produces $882 billion, within rounding of the $870 billion disclosed. The construction is reproducible from the cited inputs.
The triangulation point: Omdia’s 2030 global fixed broadband revenue projection is approximately $440–470 billion annually for the entire global fixed broadband market — terrestrial and satellite combined. Ericsson’s projection is similar at $400–450 billion. Grand View Research extends to $650–700 billion. The SpaceX-claimed $870 billion addressable broadband market is approximately 2x the named sources’ projections for the entire global fixed broadband market in 2030, including all terrestrial operators.
The risk factor language is precise. Counts come from the third-party sources. Pricing and penetration assumptions come from “our internal expectations regarding pricing, adoption rates and service penetration across different geographic regions and economic environments.” The third-party sources provide the population base. The internal assumptions, applied to that base, produce a figure approximately twice what the same sources project for the entire global market.
The operational reality: 10.3 million Starlink Subscribers as of March 31, 2026, with ARPU of $66 per month, declining from $99 in 2023 [S-1, Connectivity segment data, p. 23]. Connectivity segment 2025 revenue of $11,387 million, with Q1 2026 annualized at approximately $13 billion. Current Starlink subscriber count is approximately 0.6% of the assumed 1.75 billion addressable household base. ARPU has declined 33% over two years as the customer base expanded into lower-priced markets.
The S-1’s own Risk Factors include the acknowledgment that “in our Connectivity segment, including Starlink broadband and Starlink Mobile, we face competition from terrestrial fixed network providers, mobile network operators, and other satellite providers, and our services may be less competitive in certain markets, including dense urban areas where terrestrial fiber and wireless networks may offer higher capacity, lower cost, or more consistent performance” [S-1, Risk Factors, p. 62]. The acknowledged competitive disadvantage applies to the highest household density and highest pricing markets.
The capital implication. Capital intensity for satellite broadband at scale is approximately 2.0x PP&E-to-revenue, consistent with terrestrial broadband operators (Comcast at 2.2x, Charter at 2.0x, Deutsche Telekom at 2.3x, BT Group at 2.5x), with satellite broadband comparables (HughesNet/Viasat at 1.5–1.7x, Eutelsat OneWeb at 3.3x in early stage), and with SpaceX’s own current Connectivity capital intensity of approximately 2x.
A 10% share of the $870 billion TAM by 2030 — approximately $87 billion in Broadband revenue, which from a 2025 base of approximately $10 billion implies a 50% compound annual growth rate consistent with recent trajectory — requires PP&E of approximately $174 billion at industry-standard intensity. Current Connectivity PP&E allocable to broadband is approximately $20–22 billion. Incremental PP&E required through 2030 for a 10% share: approximately $150–155 billion.
The Connectivity segment’s own EBITDA generation supports a portion of this capital deployment. 2025 segment Adjusted EBITDA was $7,168 million; growth trajectories consistent with reaching 10% TAM produce cumulative segment EBITDA through 2030 of approximately $80–120 billion. The Broadband-specific incremental capital requirement of $150–155 billion exceeds the segment’s full cumulative EBITDA generation; cross-segment cash flow or external financing supplies the remainder.
Connectivity Mobile — $740 Billion
The Connectivity Mobile construction follows the same methodology type — count of addressable devices multiplied by ARPU and monthly service revenue. The named sources include Omdia’s “Mobile Forecasts Summary” [S-1 citation xxiv], the Ericsson Mobility Report [S-1 citation v], J.D. Power’s wireless network quality analysis [S-1 citation xii], the CTIA’s spectrum shortfall report [S-1 citation ii], and the Global Satellite Operators Association’s “Satellite Solutions for Universal Service” [S-1 citation vii].
The reproducible math: approximately 8 billion mobile devices in active use globally; excluding China and Russia reduces the base by approximately 1.5 billion devices to roughly 6.5 billion addressable. At an assumed weighted-average ARPU of approximately $9.50 per month, 6.5 billion × $9.50 × 12 produces $741 billion, matching the $740 billion disclosed.
The triangulation point: Omdia’s 2030 global mobile service revenue projection is approximately $1.1–1.2 trillion for the entire global mobile services market — every mobile carrier, every device, every service tier combined. The satellite-to-mobile component within that projection is approximately $5–15 billion by 2030 in Omdia’s published scenarios. Ericsson’s adjacent projection has the satellite-to-mobile component at $10–20 billion. Broader analytical work from Counterpoint Research, Northern Sky Research, and Analysys Mason places the entire satellite-to-mobile market — AST SpaceMobile, Iridium, Globalstar, Starlink Mobile combined — in the $15–30 billion range by 2030.
The SpaceX-claimed $740 billion Mobile TAM is approximately 25–50x what the broader industry analytical apparatus projects for the entire satellite-to-mobile market in 2030.
The structural feature: Starlink Mobile is positioned in the S-1’s own Business section as “supplementing terrestrial networks and substantially reducing mobile ‘dead zones’” [S-1, Business — Our Leading Capabilities, p. 16]. It is positioned as the supplementary layer, not as primary mobile service. The TAM construction treats every mobile device globally as addressable at approximately $9.50 per month — every mobile device subscribing to supplementary satellite coverage at roughly 10–15% of typical wireless ARPU.
The operational reality: 7.4 million monthly unique devices across approximately 30 countries, served by approximately 650 V1 Mobile satellites [S-1, Prospectus Summary, p. 8]. Current Mobile revenue is bundled within the Connectivity segment and not separately disclosed; industry estimates place it in the $100–260 million annualized range through MNO partnership revenue sharing. Current device count is approximately 0.1% of the assumed 6.5 billion addressable base. The multiplier from current operations to TAM is approximately 3,000–7,000x.
The S-1’s own Risk Factors acknowledge the operational dependencies that the TAM construction does not address: “The expansion of our satellite-to-mobile connectivity services depends substantially on our ability to secure and maintain partnerships with mobile network operators and on the adoption of necessary hardware and software modifications by device manufacturers... To achieve full 5G NR-NTN compliance and optimal performance would likely require handset manufacturers to implement hardware and software modifications, primarily to the radio-frequency front end, in future devices. We do not have direct contractual arrangements with handset manufacturers; instead, we expect MNO partners, as major purchasers of mobile devices, to encourage or drive such adoption. There can be no assurance that these modifications will be adopted on our preferred timeline, or at all” [S-1, Risk Factors, p. 62].
The Mobile service depends on the EchoStar Spectrum Transaction ($11.5 billion plus 261.8 million shares of Class A common stock) closing in November 2027, on international spectrum approvals being granted country by country, on handset hardware modifications being adopted by device manufacturers, and on MNO partnerships in markets representing the addressable device base (currently 30 of approximately 200 countries). All four dependencies are present-tense constraints; the TAM is not.
The capital implication. Capital intensity for dedicated satellite-to-mobile infrastructure at scale runs at approximately 2.5–3.0x PP&E-to-revenue, somewhat higher than broadband because the V2 Mobile constellation requires dedicated satellites separate from broadband satellites. A 10% share of $740 billion — approximately $74 billion in Mobile revenue by 2030 — implies PP&E of approximately $185–222 billion at industry-standard intensity. Current Mobile-allocable PP&E is approximately $3–5 billion (650 V1 Mobile satellites plus pro-rata ground and manufacturing). Incremental PP&E required through 2030 for a 10% share: approximately $195–200 billion. Plus the EchoStar Spectrum Transaction at $11.5 billion in cash and 261.8 million Class A shares.
The Mobile capital requirement runs alongside, not within, the Broadband requirement. Combined Connectivity incremental PP&E for 10% share targets by 2030: approximately $345–355 billion.
AI Infrastructure — $2.4 Trillion
The AI Infrastructure construction follows the methodology described in the TAM Risk Factor paragraph: projections of global data center compute demand from third-party sources, combined with internal assumptions on the portion of global compute capacity utilized for AI workloads, power usage, utilization rates, and pricing. The named primary source is RAND Corporation’s “AI’s Power Requirements Under Exponential Growth,” January 28, 2025 [S-1 citation xxvi].
The reproducible math: RAND projects approximately 235 GW of global data center demand by 2030. Internal assumption of approximately 70% AI workloads produces approximately 164.5 GW of AI compute capacity. At hardware density of approximately 1.3 kW per GPU (H100 class accounting for cooling overhead at PUE 1.2), 164.5 GW divided by 1.3 kW equals approximately 126.5 million GPUs. At Silicon Data’s 2025 median H100 rental rate of $3.33 per hour [S-1 citation xxx], 80% utilization, 8,760 hours per year: $3.33 × 7,008 productive hours × 126.5 million GPUs = approximately $2.95 trillion. Within range of $2.4 trillion at modest input adjustments.
The triangulation point: McKinsey’s “The Cost of Compute: A $7 Trillion Race to Scale Data Centers” [S-1 citation xvi] projects $7 trillion in cumulative data center capex through 2030 globally — the supply-side construction cost, not the revenue. McKinsey’s 2030 AI services revenue projection in the same and adjacent reports is in the $1–2 trillion range. Bain & Company projects 2030 total AI market at $1.5–2 trillion combined services and infrastructure. Gartner projects 2030 AI infrastructure spending at approximately $400–500 billion annually. IDC projects 2030 AI infrastructure market at $500–700 billion. Goldman Sachs Research projects total AI market at $1–1.5 trillion by 2030.
The consensus range from major analytical firms is $1–2 trillion for the total AI market in 2030. The SpaceX-claimed $2.4 trillion AI Infrastructure TAM alone, before consumer subscriptions, digital advertising, or enterprise applications are added, is at or above the high end of total AI market projections from major analysts.
The pricing input deserves separate triangulation. The construction uses Silicon Data’s 2025 median H100 rental rate of $3.33 per hour. The Silicon Data report itself documents the rate declining from approximately $8 per hour in early 2023 to $3.33 by Q4 2025 — a 60% decline over approximately 24 months. Industry projections for AI compute rental rates through 2030 generally show continued decline as supply matures and as new chip generations (Blackwell, Vera Rubin) cycle in. At a 2030 projected rental rate of approximately $1.75 per hour, consistent with the cited source’s documented trajectory, the same construction with the same power and utilization assumptions produces approximately $1.24 trillion — roughly half the $2.4 trillion figure. The price held constant from 2025 is the input producing the difference.
The operational reality: SpaceX’s AI compute facilities, COLOSSUS and COLOSSUS II, collectively provide approximately 1.0 GW of nameplate compute draw [S-1, Business — AI Compute Infrastructure, p. 18]. Cumulative AI segment capex through Q1 2026: approximately $19 billion (2024: $5.6 billion; 2025: $12.7 billion; Q1 2026: $7.7 billion) [S-1, Capital Expenditures, p. 23]. Demonstrated capital intensity: approximately $19–20 billion per GW of deployed capacity. AI segment 2025 revenue: $3,201 million, with 2025 operating loss of $6,355 million [S-1, AI segment data, p. 23].
The Anthropic compute services agreement, executed in May 2026, provides $1.25 billion per month through May 2029 with reduced ramp in May and June 2026 [S-1, Prospectus Summary — Compute Services Agreements, p. 9]. At full ramp, approximately $15 billion annual revenue contribution. The S-1 notes the company expects “to enter into additional similar services contracts.”
The capital implication. Industry-standard greenfield AI data center buildout costs at scale are approximately $30–40 billion per GW, including land, power, structure, and compute hardware, with GPUs accounting for 60–70% of total cost per JLL’s “2026 Global Data Center Outlook” [S-1 citation xiv]. SpaceX’s demonstrated cost is approximately $19–20 billion per GW, reflecting both rapid deployment (122 days for COLOSSUS, 91 days for COLOSSUS II) and the structural advantage the S-1 claims: “data center construction costs for COLOSSUS II that are considerably lower than industry benchmarks on a per megawatt basis” [S-1, Business — Our AI Compute Infrastructure Advantage, p. 19]. The chip cost component remains exposed to market pricing for compute hardware.
A 5% share of global AI compute capacity by 2030 (approximately 8.2 GW of 164.5 GW global AI capacity) at midpoint capital intensity of approximately $27 billion per GW: approximately $220 billion in incremental capital. A 10% share at midpoint intensity: approximately $445 billion. Range across favorable and industry-standard assumptions: $160–578 billion. Midpoint scenario at approximately 7.5% share and midpoint intensity: approximately $335 billion in incremental capital through 2030.
The disclosed commitments include items that bear directly on this capital requirement. The Anthropic agreement is a revenue commitment that partially funds the capital deployment. The Cursor option, at $60 billion equity value with $10 billion in services and termination fees, reflects rather than reduces the underlying capital intensity — hyperscale AI participation requires capital at scale. Terafab, the chip manufacturing initiative with Tesla and Intel, is described in the S-1 as “subject to separate negotiations and agreements (including any development timelines, milestones and capital expenditures) [that] have not yet been determined” [S-1, Prospectus Summary, p. 4]. Industry estimates place cumulative Terafab capital at approximately $55 billion if it advances to full chip manufacturing scale. Each of these is evidence that participating in AI infrastructure at scale is more capital-intensive than industry-standard benchmarks, not less.
Plus orbital AI compute infrastructure on top. The S-1 describes deployment beginning as early as 2028 of “100 gigawatts per year via satellites carrying over 100 kilowatts of compute power per metric ton” requiring “thousands of launches per year and the transport of approximately one million metric tons to orbit annually” [S-1, Business — Orbital AI Compute, pp. 19–20]. Capital required for meaningful orbital AI compute capacity through 2030: additional $50–100 billion beyond terrestrial buildouts.
Consumer Subscriptions — $760 Billion
The Consumer Subscriptions construction is a population-times-ARPU build. The primary input source is Euromonitor International Passport 2026 Edition for population data [S-1 citation vi]. The YouGov report on AI usage and trust [S-1 citation xli] provides supporting data on consumer adoption rather than market size.
The reproducible math: approximately 5.5 billion people aged 10+ globally, excluding China and Russia. At an assumed weighted-average ARPU of approximately $11.50–12.00 per month, 5.5 billion × $11.75 × 12 produces approximately $776 billion, within rounding of the $760 billion disclosed. The pricing assumption is calibrated against existing consumer AI subscription tiers (SuperGrok at $30 per month, ChatGPT Plus at $20 per month, Gemini Advanced at $20 per month, Claude Pro at $20 per month), weighted down for free-tier conversion and emerging-market pricing.
The triangulation point: Counterpoint Research projects the 2030 consumer AI subscription market at approximately $40–60 billion. Bain projects $50–75 billion. Gartner projects the consumer AI software market at approximately $45–65 billion in 2030. The SpaceX-claimed $760 billion addressable is approximately 12–19x the broader analytical apparatus projects for the entire consumer AI subscription market.
The operational reality: Grok has approximately 117 million monthly active users using AI features as of March 31, 2026, of the 550 million total MAUs across Grok and X [S-1, Business — AI segment, p. 17]. Paid subscribers are a subset; industry estimates place xAI paid subscribers in the 2–5 million range. Current Grok consumer subscription revenue: approximately $200–500 million annualized. Multiplier from current operations to TAM: approximately 1,500–4,000x.
The capital implication. Consumer subscription businesses are software/platform businesses with PP&E-to-revenue at approximately 0.2–0.4x. The compute infrastructure supporting inference is captured in the AI Infrastructure capital base; the consumer-facing platform itself is light on incremental capital. For a 5–10% share by 2030 ($38–76 billion revenue), incremental PP&E beyond what is counted in AI Infrastructure: approximately $5–15 billion.
The Consumer Subscriptions line does not contribute materially to the cumulative capital base relative to the larger infrastructure-intensive components. Its analytical significance is what the multiplier reveals about the construction’s methodology — the same methodology family that produced the Connectivity Mobile $740 billion figure.
Digital Advertising — $600 Billion
The Digital Advertising component sources the $600 billion figure from S&P Global Market Intelligence's 2025 measurement of global digital advertising spending. The S-1 positions the opportunity as addressable for the X platform, integrated with Grok and the broader xAI ecosystem.
The structural feature: the global digital advertising market is concentrated in a small number of platforms. The top four digital advertising platforms (excluding China) hold approximately 80% of global digital advertising revenue. Google generated approximately $260 billion in advertising revenue in 2025; Meta approximately $160 billion; Amazon approximately $55 billion; ByteDance ex-China approximately $25–30 billion. Google and Meta combined hold approximately $420 billion of the global digital advertising market. The $600 billion SpaceX-claimed addressable is approximately 1.4x the combined current advertising revenue of Google and Meta.
X is currently in the second tier of digital advertising platforms, with revenue less than 1% of the leaders. The market leadership positions of Google, Meta, and Amazon are entrenched through decade-plus accumulation of audience, data, advertiser relationships, and advertising technology infrastructure. The TAM positioning of $600 billion as addressable for X — through integration with Grok and AI-mediated advertising — implies either substantial share displacement from the entrenched incumbents or a category redefinition where AI-mediated advertising is treated as additive to traditional digital advertising rather than displacing portions of it. The construction does not address what mechanism would produce either outcome at the scale required.
The capital implication. Digital advertising platforms are software and platform businesses with low PP&E intensity. For a 5–10% share by 2030 ($30–60 billion in revenue), incremental PP&E is approximately $6–24 billion beyond what is counted in AI Infrastructure.
Enterprise Applications — $22.7 Trillion
The Enterprise Applications component is the largest single line in the TAM disclosure — 80% of the total $28.5 trillion, 86% of the $26.5 trillion AI segment total. The construction derives from a single source: the Digital Cooperation Organization’s “Digital Economy Trends 2026,” December 2025 [S-1 citation iv].
The DCO is an intergovernmental organization founded in 2020 by Saudi Arabia, Bahrain, Jordan, Kuwait, Oman, and Pakistan, with subsequent member additions. Its 2026 Digital Economy Trends report measures the global digital economy at approximately $22.7 trillion. The DCO’s definition of the digital economy: economic activity that is “reliant on, significantly enhanced, or enabled by digital technologies.”
The methodology is a sector-spanning GDP-contribution measurement. The DCO measures the digital economy across approximately 12 categories: digital infrastructure (telecommunications, data centers, internet services); digital trade and e-commerce; digital financial services; digital health, education, and government services; software and IT services; AI and machine learning applications; data services and analytics; platform economies (social media, sharing economy, marketplaces); digital media and entertainment; IoT and connected devices; and digital manufacturing and automation. The aggregate measurement captures total economic activity across these sectors — Amazon’s e-commerce GMV, Walmart’s online sales, Netflix’s subscription revenue, Visa and Mastercard’s payment processing, the entire global telecommunications industry, the SaaS industry, online advertising, cloud computing, IT services, digital banking, online education, online healthcare.
Against 2026 global GDP per the World Bank of approximately $115 trillion [S-1 citation xxxviii], the DCO’s $22.7 trillion measurement is approximately 19.7% of global GDP.
The triangulation point: industry-standard measurements of the global enterprise applications and software market — software and services that businesses purchase to manage their operations — place the 2030 market at approximately $1.1–1.4 trillion. Gartner’s 2030 global enterprise software market: $1.1–1.3 trillion. IDC’s 2030 enterprise software market: $1.2–1.4 trillion. McKinsey’s 2030 AI-enabled enterprise software market: $300–500 billion. Bain’s 2030 enterprise AI services: $200–400 billion.
The SpaceX-claimed $22.7 trillion enterprise applications TAM is approximately 16–20x the conventional industry measurement of the entire enterprise software and applications market in 2030. The construction reaches an order-of-magnitude higher figure because it sources a fundamentally different measurement.
The operational reality: SpaceX has effectively no current revenue from enterprise applications as the term is conventionally used. Macrohard is described in the S-1 as currently in development [S-1, Prospectus Summary, p. 5]. xAI Gov and Grok Enterprise are early-stage offerings without disclosed revenue. The Anthropic compute services agreement is enterprise compute infrastructure, not enterprise applications. There is no current SpaceX enterprise applications business at meaningful scale. Against the $22.7 trillion claimed addressable, current revenue from this category is approximately zero.
The capital implication. Conventional enterprise applications businesses have low PP&E intensity — software and services with PP&E-to-revenue of approximately 0.1–0.3x. Compute infrastructure supporting AI-enabled applications is captured in the AI Infrastructure capital base. The enterprise applications business itself, separate from infrastructure, requires minimal additional PP&E.
But the relevant capital question is not PP&E. It is the operational architecture required to build and operate an enterprise applications business at any meaningful share of a $22.7 trillion claimed market. The S-1 does not allocate capital expenditure to enterprise applications as a category. The disclosed capex breakdown is by segment — Space, Connectivity, AI — with the AI segment capex covering compute infrastructure, model development, and platform development, not enterprise applications operations.
To address an enterprise applications market at even 0.1% share ($22.7 billion in revenue) requires a sales force in the tens of thousands of people; customer success and professional services organizations; a partner channel and systems integrator ecosystem; industry-specific go-to-market organizations; compliance, security, and procurement infrastructure for enterprise sales; and geographic expansion into every major market globally. None of these operational requirements is reflected in current SpaceX operations or disclosed commitments.
The Enterprise Applications line, taken on its own terms: methodology is single-source attribution to a GDP-adjacent measurement of the global digital economy; magnitude is 80% of the total TAM disclosure and approximately 20% of 2026 global GDP; no capital is allocated to it in the disclosed commitments; no operational architecture is described in the business operations; current revenue from this category is approximately zero.
And one further structural observation. SpaceX is operationally a space and connectivity company — current revenue concentrates in Connectivity; current capital expenditure concentrates in Space and AI infrastructure. The TAM disclosure positions the company differently. Eighty percent of the claimed addressable market is enterprise applications, a category in which the company has no current operations, no allocated capital, and no disclosed operational architecture. The TAM presents what the addressable market would require the company to be. The operations and capital structure reflect what the company actually is.
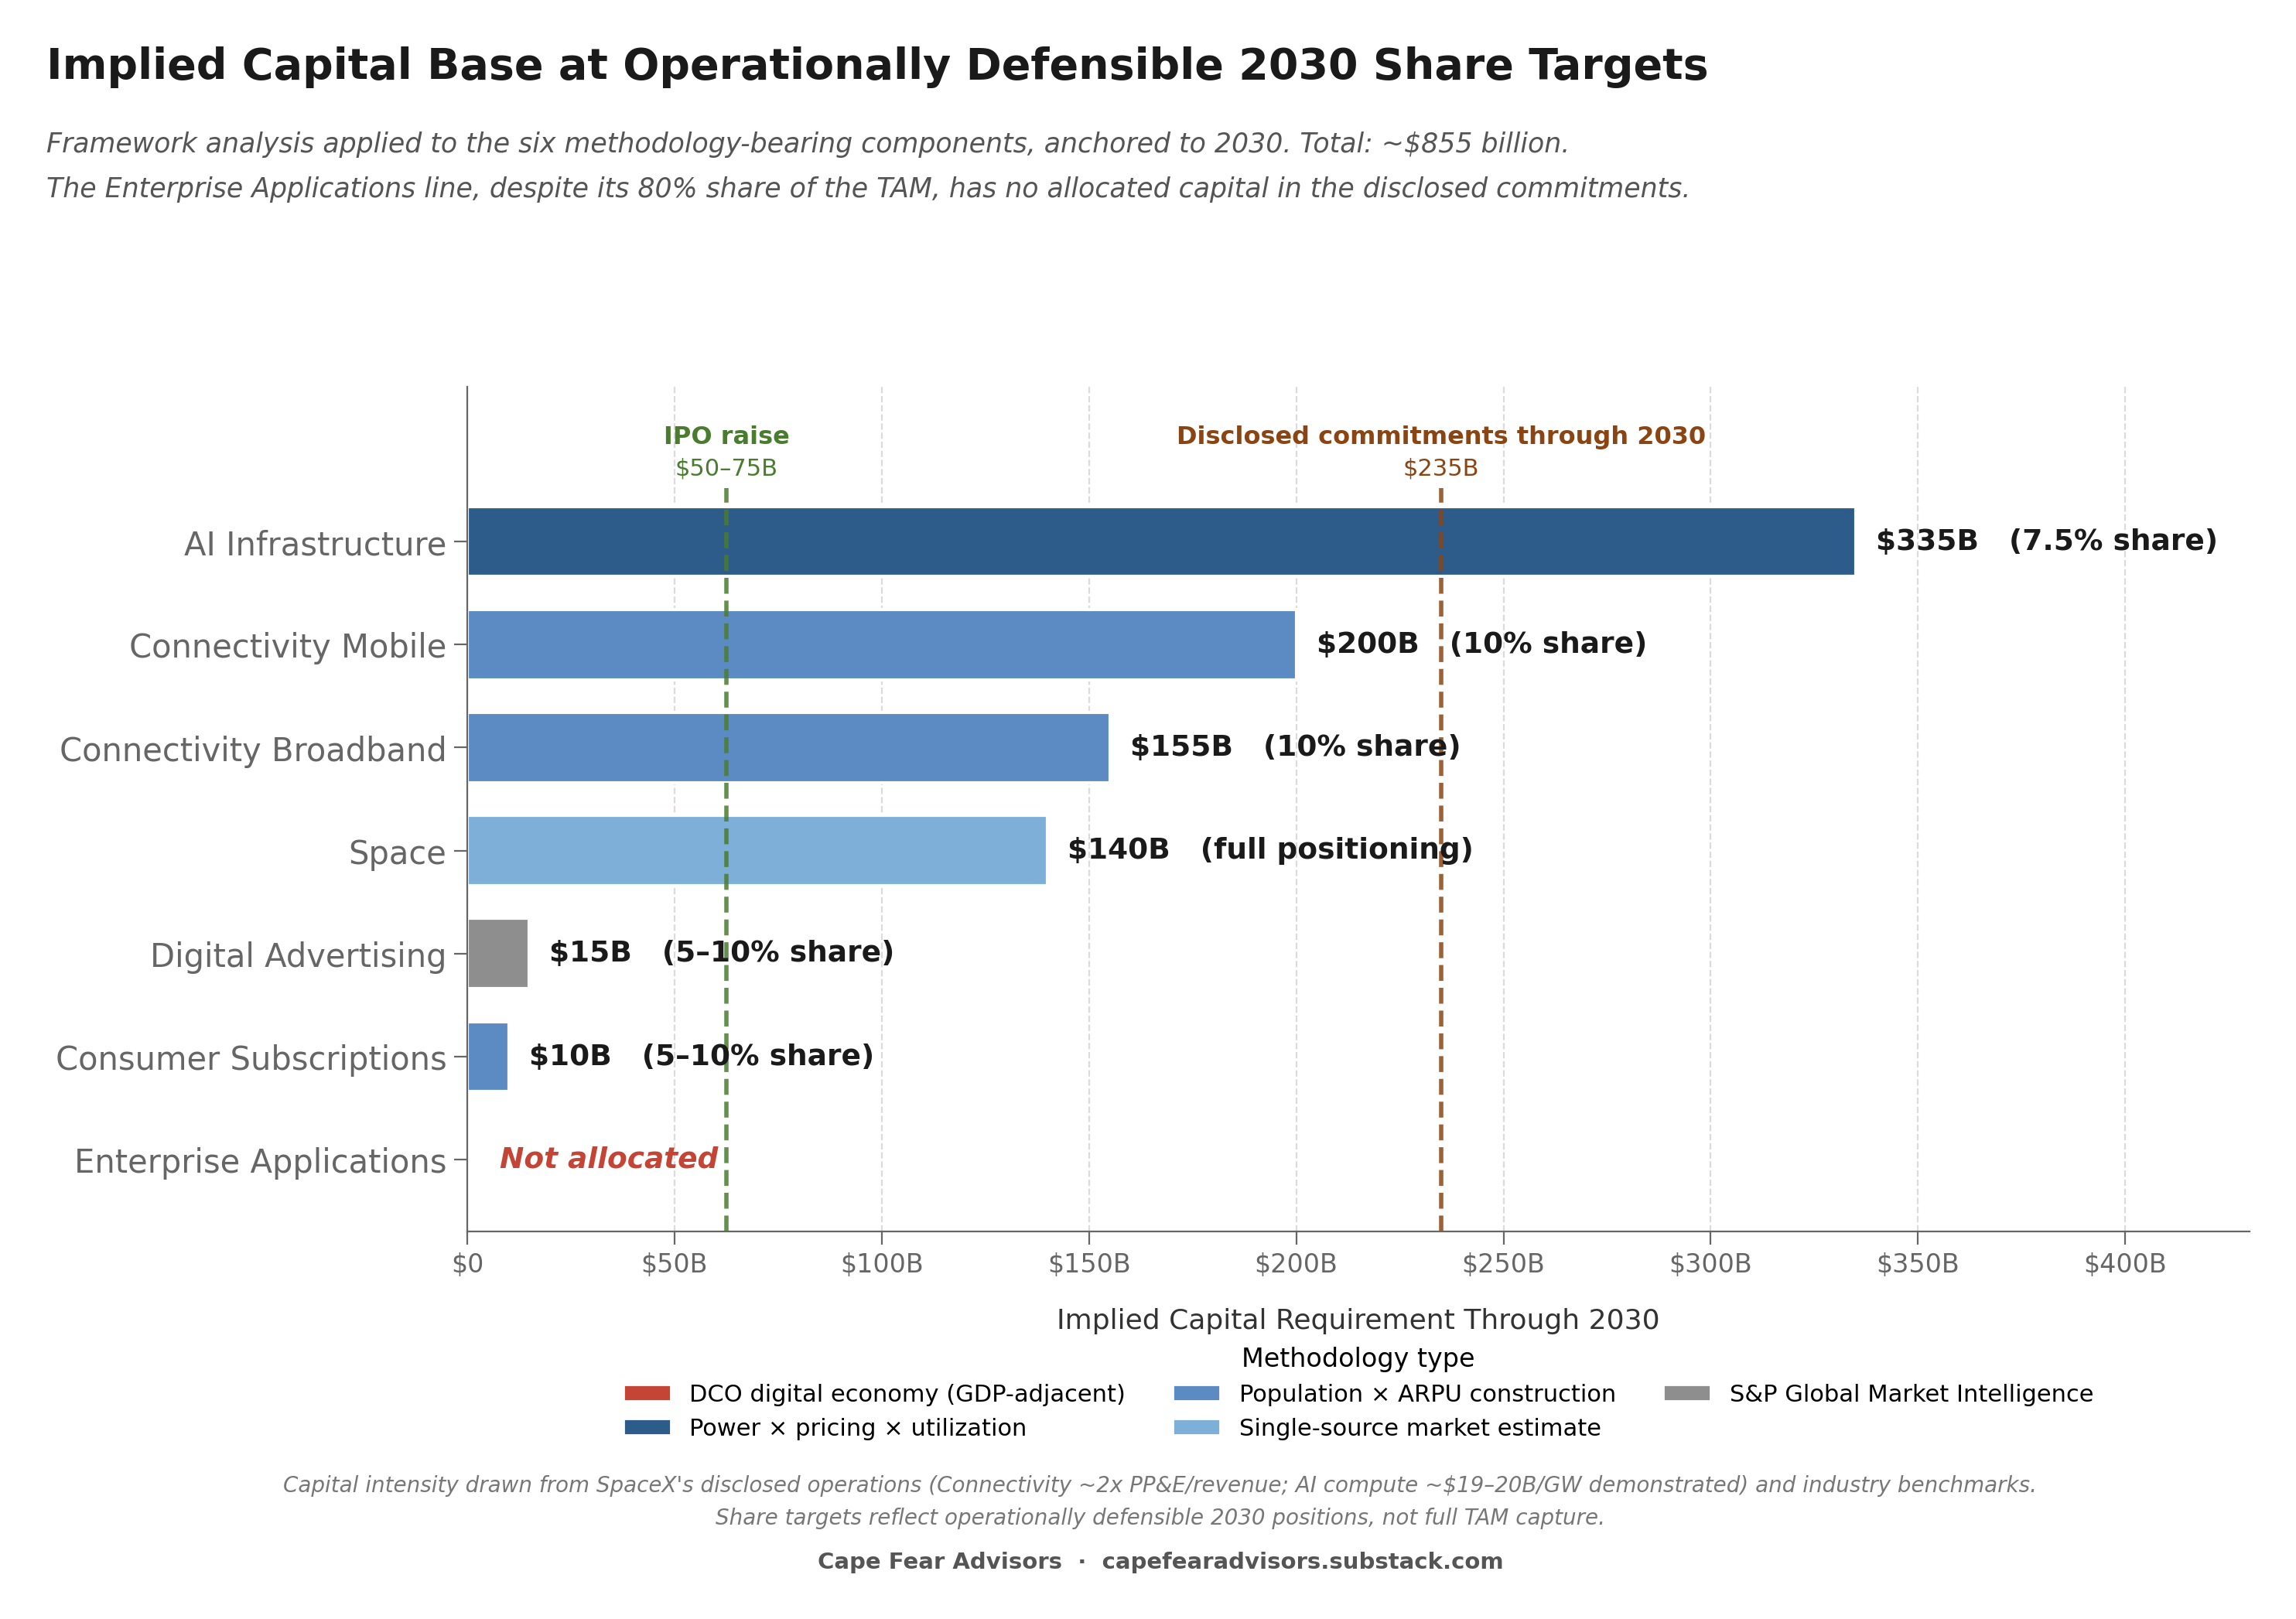
Caption: At industry-standard capital intensity applied to operationally defensible share targets for the six methodology-bearing components, the implied capital base through 2030 is approximately $855 billion. The IPO raise of $50–75 billion and the framework’s $235 billion aggregation of disclosed commitments through 2030 are shown for reference. The Enterprise Applications component, despite its 80% share of the TAM, has no allocated capital in the disclosed commitments.
Observed and Unobserved
The S-1 is a regulatory disclosure document. It observes substantial operational reality: current revenue and segment breakdown; subscriber counts and ARPU trajectory; AI compute capacity and demonstrated deployment; capital expenditure run rates by segment; the balance sheet including $54 billion in PP&E, $29 billion in outstanding debt, $41 billion in accumulated deficit. It observes substantial forward commitments: the Bridge Loan; the Anthropic compute services agreement; the Cursor option and termination/services fee structure; the Valor acquisition; the EchoStar spectrum transaction with its cash and share components; the Terafab framework agreement with Tesla and Intel; the ongoing investment requirements of the AI segment.
The TAM construction sits within this regulatory architecture but operates differently. The TAM is presented as opportunity assessment — what is addressable — without the corresponding disclosure of what addressing it would require, when, or how.
What the S-1 does not disclose, against the TAM construction:
— The anchor year for the TAM. The disclosure is present tense; the inputs span present-year measurements through 2030-projected demand to 2025-priced compute held constant. Industry analytical convention requires specified forecast horizons; the S-1’s TAM does not specify one.
— The capital base required to address the TAM. The S-1 discloses capital expenditure run rates through 2030 in separate sections but does not aggregate them and does not project the capital base required to address the claimed addressable market at scale. This analysis establishes that at industry-standard capital intensity for operationally defensible share targets in the six methodology-bearing components, the requirement is approximately $850–900 billion in incremental capital by 2030. The S-1 does not perform this calculation or disclose its result.
— The operational architecture for Enterprise Applications. The $22.7 trillion claim implies an operational base that the S-1 does not disclose. No enterprise applications segment is presented in the financial statements. No sales force, customer success organization, partner channel, or professional services capability is described in the business operations. No capital is specifically allocated to building such operations.
— The methodology for Digital Advertising. The six other components have identifiable source attribution from the industry data citations. Digital Advertising is the exception. The construction is not visible from the front-matter disclosures.
— The trajectory of compute hardware rental pricing through 2030. The S-1 cites Silicon Data’s H100 Rental Price Over Time analysis [citation xxx], which documents the rate declining from approximately $8 per hour in 2023 to $3.33 in 2025. The AI Infrastructure TAM construction uses the 2025 figure forward to 2030 without addressing the documented price decline trajectory.
— The share assumptions baked into each TAM component. The S-1 reports the addressable market; the implied capture assumption is not disclosed. This analysis adopts operationally defensible share targets (10% for Connectivity, 5–10% for AI Infrastructure) for the purpose of capital intensity calculation; the S-1 itself provides no such targets.
— The federal procurement environment the TAM assumes. The Risk Factors disclose the current 20% federal revenue concentration and acknowledge federal dependency as a risk factor [S-1, Risk Factors, p. 57]. The TAM construction depends, particularly for Space and indirectly for other segments, on federal procurement expanding at scale. The S-1 does not disclose the federal procurement environment its TAM assumes.
Each of these is a disclosure that the regulatory architecture does not require. The S-1 is compliant with disclosure standards as those standards are conventionally applied to TAM presentations. The framework reading is that the disclosure architecture permits the assertion of addressable market without the corresponding disclosure of what addressing it would require.
Cash Implications
The cash gap established in the prior analysis (”SpaceX, Adding It Up — The $235 Billion Cash Gap”) aggregated the disclosed cash commitments through 2030 — Bridge Loan, Anthropic compute services obligations, Cursor option mechanics, Valor acquisition, EchoStar spectrum, Terafab framework, and AI segment ongoing losses — at approximately $235 billion against an IPO raise of $50–75 billion. The aggregation was the framework’s analytical work; the S-1 does not present the $235 billion figure. The S-1 discloses the components in separate sections.
This analysis extends the framework’s work in a second direction. At industry-standard capital intensity applied to operationally defensible share targets for the six methodology-bearing TAM components, the incremental capital requirement through 2030 is approximately $850–900 billion. This figure is also the framework’s analytical work; the S-1 does not present it. The S-1 discloses the inputs — TAM by component, current operational data, demonstrated capital intensity in current operations — but does not perform the calculation.
The combined picture, from the framework’s analytical work applied to the S-1’s disclosed components:
— Disclosed forward commitments through 2030 (framework aggregation): approximately $235 billion.
— Implied additional capital for operationally defensible share targets in the six methodology-bearing components (framework calculation): approximately $615–665 billion beyond the disclosed commitments.
— Total implied capital base through 2030: approximately $850–900 billion.
— Disclosed funding sources (IPO raise, current cash on hand, expected operating cash generation from profitable segments through 2030): approximately $200–275 billion.
— Implied funding gap by 2030: approximately $575–700 billion. Against an IPO raise of $50–75 billion, the coverage ratio is approximately 7–13%.
The funding architecture disclosed in the S-1 deserves separate attention. The S-1 names the IPO as the primary cash event. The Bridge Loan and Credit Facility provide cash borrowing capacity. Beyond these, the disclosed major strategic commitments are denominated in stock rather than cash: the Cursor consideration would be “shares of our Class A common stock based on an implied equity value of Cursor of $60.0 billion” [S-1, Prospectus Summary — Collaboration with Cursor, p. 9]; the EchoStar spectrum transaction includes a 261.8 million share component; the directed share program for employees and designated individuals is part of the IPO mechanics; future acquisitions and partnerships are presumed to follow similar structures.
The architecture works for one set of commitments and not for another. Stock-denominated consideration funds acquisitions where the seller accepts stock; it funds partnerships where the counterparty accepts stock-denominated obligations. The physical infrastructure that the TAM construction implies — satellites, data centers, launch vehicles, chip facilities, ground stations — is paid for in cash, ultimately sourced from operating cash flow, debt issuance, or equity issuance converted to cash in the capital markets. At the implied scale of the capital base, the equity-issuance-to-cash channel would require capital markets to absorb dilution at a magnitude that itself becomes a constraint. The disclosed funding architecture, structured for direct stock-denominated commitments, addresses one set of capital requirements. The physical infrastructure requirements at TAM scale require a different funding architecture than the one disclosed.
Three sources of capital are available at the implied scale. Two appear in the S-1’s funding architecture. The third is required by the math but is not named in the funding architecture.
Sustained debt expansion is disclosed. SpaceX has $29.1 billion in current outstanding principal indebtedness [S-1, Risk Factors, p. 60]. The Credit Facility was amended in May 2026 to increase borrowing capacity and extend the maturity date. The 22-bank underwriting syndicate listed on the prospectus cover provides a deep capital markets relationship. The structural feature: the implied capital base requires sustained debt issuance at substantial scale through 2030.
Sustained equity issuance is disclosed. The dual-class share structure preserves voting control while permitting substantial Class A share issuance for acquisitions and capital raises. The directed share program, the Cursor stock consideration, the EchoStar share component, and the broader Class A share supply mechanics all support continued equity issuance. The structural feature: the implied capital base requires sustained Class A share dilution at substantial scale, with voting control preserved through the dual-class structure.
Federal procurement at sovereign scale is required by the math but not named in the funding architecture. The Space TAM requires federal procurement expansion at scale — Artemis program expansion, Space Force contracts at materially larger run rates, NSSL expansion. The Connectivity TAM, particularly for satellite-to-mobile, requires federal commitment to spectrum access and FCC support. The AI Infrastructure TAM, particularly for compute supporting national security applications including xAI Gov and Starshield, requires federal commitment to AI infrastructure procurement at scale. The S-1 discloses the current 20% federal revenue concentration as a baseline but does not project the federal commitment expansion that the TAM construction implies.
Against the implied $575–700 billion funding gap, even sustained debt expansion and equity issuance at aggressive scale cannot close the gap without federal commitment that scales with the implied capital base. The math points at the source the disclosure does not name.
Closing
The math points at the construction. The TAM disclosure synthesizes inputs of different vintages from a citation list of 41 sources, anchored to no specific year, and produces a $28.5 trillion figure that 80% derives from a measurement of the global digital economy rather than the conventional enterprise applications market. The aspiration gets translated into something different in the disclosure.
The math points at the capital. At industry-standard capital intensity applied to operationally defensible share targets for the six methodology-bearing components, the implied capital base through 2030 is approximately $850–900 billion. Against disclosed funding sources of approximately $200–275 billion, the funding gap is approximately $575–700 billion. The disclosed funding architecture is structured for acquisitions and partnerships, not for the physical infrastructure that the TAM construction implies.
The math points at the governance. The disclosed governance and control structure provides controller discretion on the timing and cost of investments, separate from their executional risk. The controller decides when and on what terms capital gets deployed. The market bears the executional outcome.
Yesterday’s piece, SpaceX, Adding It Up — The $235 Billion Cash Gap, worked the present tense. It aggregated the cash commitments the S-1 discloses through 2030 — Bridge Loan, Anthropic compute services, Cursor option, Valor acquisition, EchoStar spectrum, Terafab framework, AI segment losses — at approximately $235 billion against an IPO raise of $50–75 billion. The aggregation was the framework’s; the S-1 discloses the components in separate sections without aggregating them.
This piece worked the implied tense. What the aspiration alone requires, before any execution, applied to the six methodology-bearing TAM components at operationally defensible share targets, is approximately $850–900 billion in incremental capital by 2030. The aggregation is also the framework’s; the S-1 makes the TAM claim and discloses the operational data, but does not perform the calculation that connects the two.
Two pieces remain before the framework reading is complete.
The next piece works the governance and the constraints. The dual-class share structure, the controlled-company exemption, the forum selection clauses, the arbitration provisions, the Texas Business Court election, the 22-bank underwriting syndicate, and the federal procurement architecture all bear on the question this piece holds out: through what mechanisms is the implied capital base supposed to be financed, and on what assumptions about the demand environment that sustains it. The math establishes the requirement. The governance and constraint structures determine how the requirement gets addressed, by whom, and on whose schedule.
The piece after that works the synthesis. The framework reading across the body of work — the disclosure architecture’s structural features, the capital intensity at sovereign scale, the controller discretion separated from executional risk, the federal commitment required by the math but not named in the funding architecture — assembles into a hypothesis the math will either support or not. The hypothesis is held until the math is in.
The aspiration alone, before any material participation in the claimed market is achieved, is the issue. The math points. The disclosure architecture does not resolve.
Author note: second reading of the S-1
A second reading of the S-1 (407 pages) has surfaced one factual error in the piece and several input differences worth noting.
The factual error: the Digital Advertising section characterizes the $600 billion figure as having "no specific source identifiable from the front-matter industry citations." This is incorrect. The S-1's Business section attributes the figure to S&P Global Market Intelligence: "In 2025, global digital advertising spending totaled $600 billion according to S&P Global Market Intelligence." The competitive analysis the section develops — that the figure represents approximately 1.4x the combined current advertising revenue of Google and Meta, and that the top four platforms hold approximately 80% of the global market — is unaffected by the source attribution. The structural observation about competitive positioning holds. The methodological-opacity characterization was wrong.
Several input differences across the methodology-bearing components: the piece's reproductions of the underlying math used inputs that, in each case, produce more conservative implied capital requirements than the S-1's own inputs would produce. Notable examples: the Connectivity Broadband composition is $660B consumer + $200B enterprise + $5B government rather than entirely consumer households at the inputs the piece used; Connectivity Mobile uses 8 billion devices globally at $8 ARPU rather than 6.5 billion at $9.50; the AI Infrastructure GPU count is approximately 104 million rather than 126.5 million when the PUE adjustment is applied. The piece's framework reading using its inputs produced an implied capital base of approximately $850-900 billion through 2030. Applied with the S-1's actual inputs, the implied capital base is somewhat higher. The funding gap and structural argument the piece develops are conservative; the document's own inputs strengthen the conclusions rather than weakening them.
The anchoring framing in the piece treats the TAM as a forward-looking 2030 construction. The S-1 actually anchors most components to current year (2025-2026), with only AI Infrastructure forward-anchored to 2030 via RAND's data center demand projection. The TAM as disclosed is mostly a current-year aggregate, which is a more aggressive claim than forward-projected addressability.
The title uses $27 trillion as the headline framing, which echoes the body of work's earlier framing of the TAM and creates the rhetorical contrast with the company's approximate $27 billion current annual revenue (the "1,000x" contrast). The S-1's stated quantifiable TAM is $28.5 trillion, which is the figure used throughout the body of the piece. The title's $27 trillion reflects the body of work's prior anchoring; the body of the piece uses the disclosed figure consistently.
The refined reading reinforces rather than revises the framework's structural observations on capital intensity, funding architecture, and disclosure features. The piece's central argument holds. The specific oversight is noted only for the record.
Thank you. Amazing write-up.